Maintenance analytics and KPI reporting
The indicators come from the work your team already records. No manual consolidation at the end of the month.
Monthly reporting is a week of spreadsheet work.
Data is collected by hand from several sources, figures are disputed and the report arrives too late to act on.
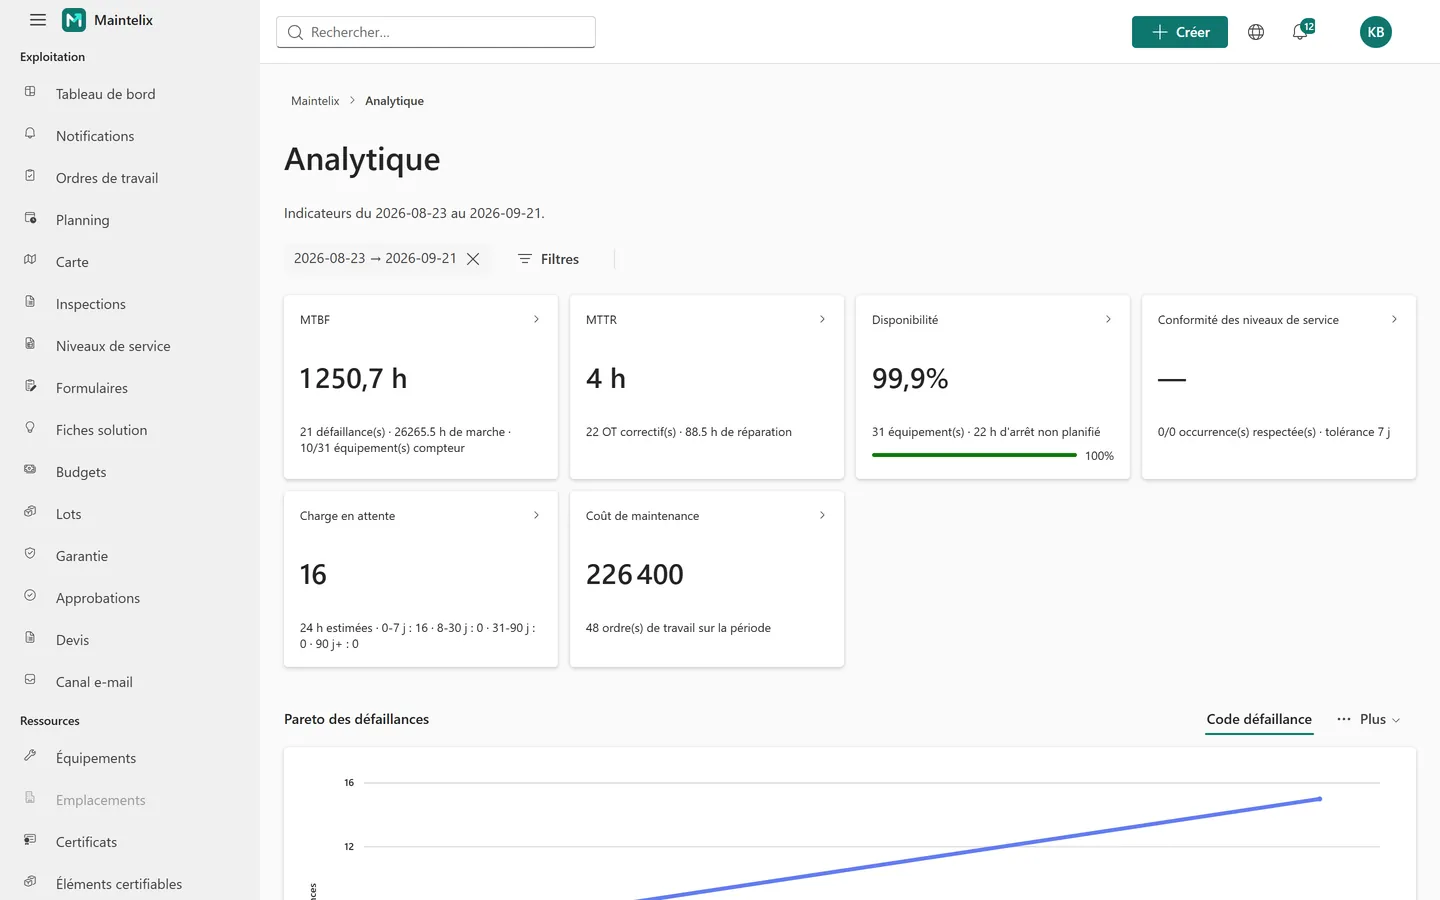
KPIs calculated from live maintenance data.
Choose a period and filters. The indicators update, and each one opens the list of records it was calculated from.
What analytics does.
Six core KPIs
MTBF, MTTR, availability, preventive compliance, backlog and maintenance cost.
Failure Pareto
Rank failures by problem, failure, cause or action code to see what to fix first.
Drill-down
Click a figure to see the work orders and assets behind it.
Operations dashboard
Overdue work, compliance and assets down, on the home screen.
Reports
Standard reports plus your own report definitions, exportable.
Budgets
Follow maintenance spending against a budget.
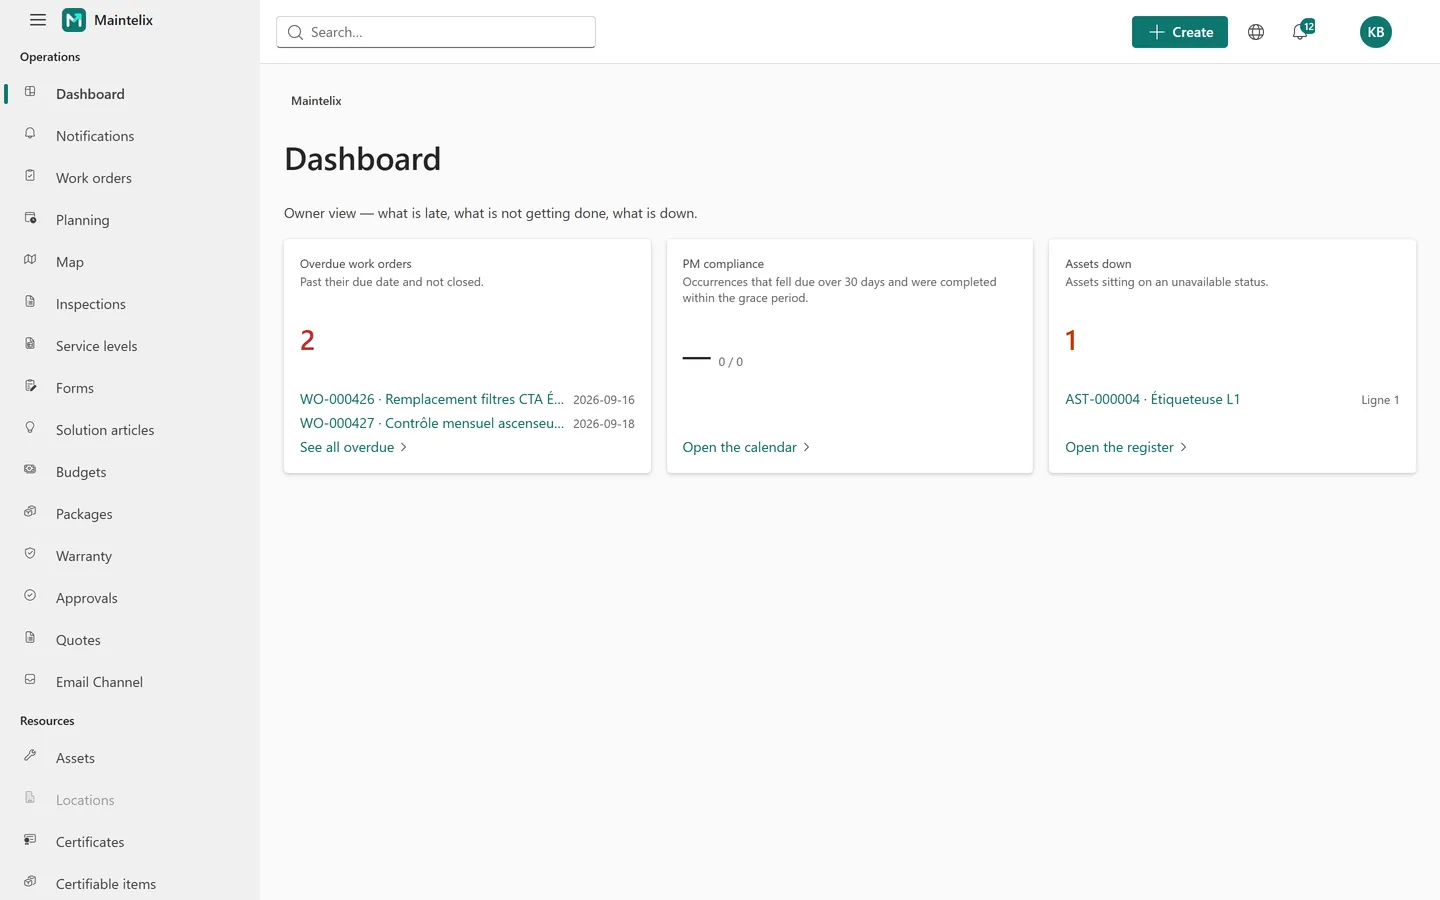
The operations dashboard.
What you gain.
- Figures everyone trusts, because they trace back to records.
- Priorities based on failure data rather than impressions.
- Reporting time given back to the maintenance team.
- A factual basis for repair-or-replace decisions.
Ready to take control of your maintenance operations?
See how Maintelix can help your team plan, execute and improve maintenance.